
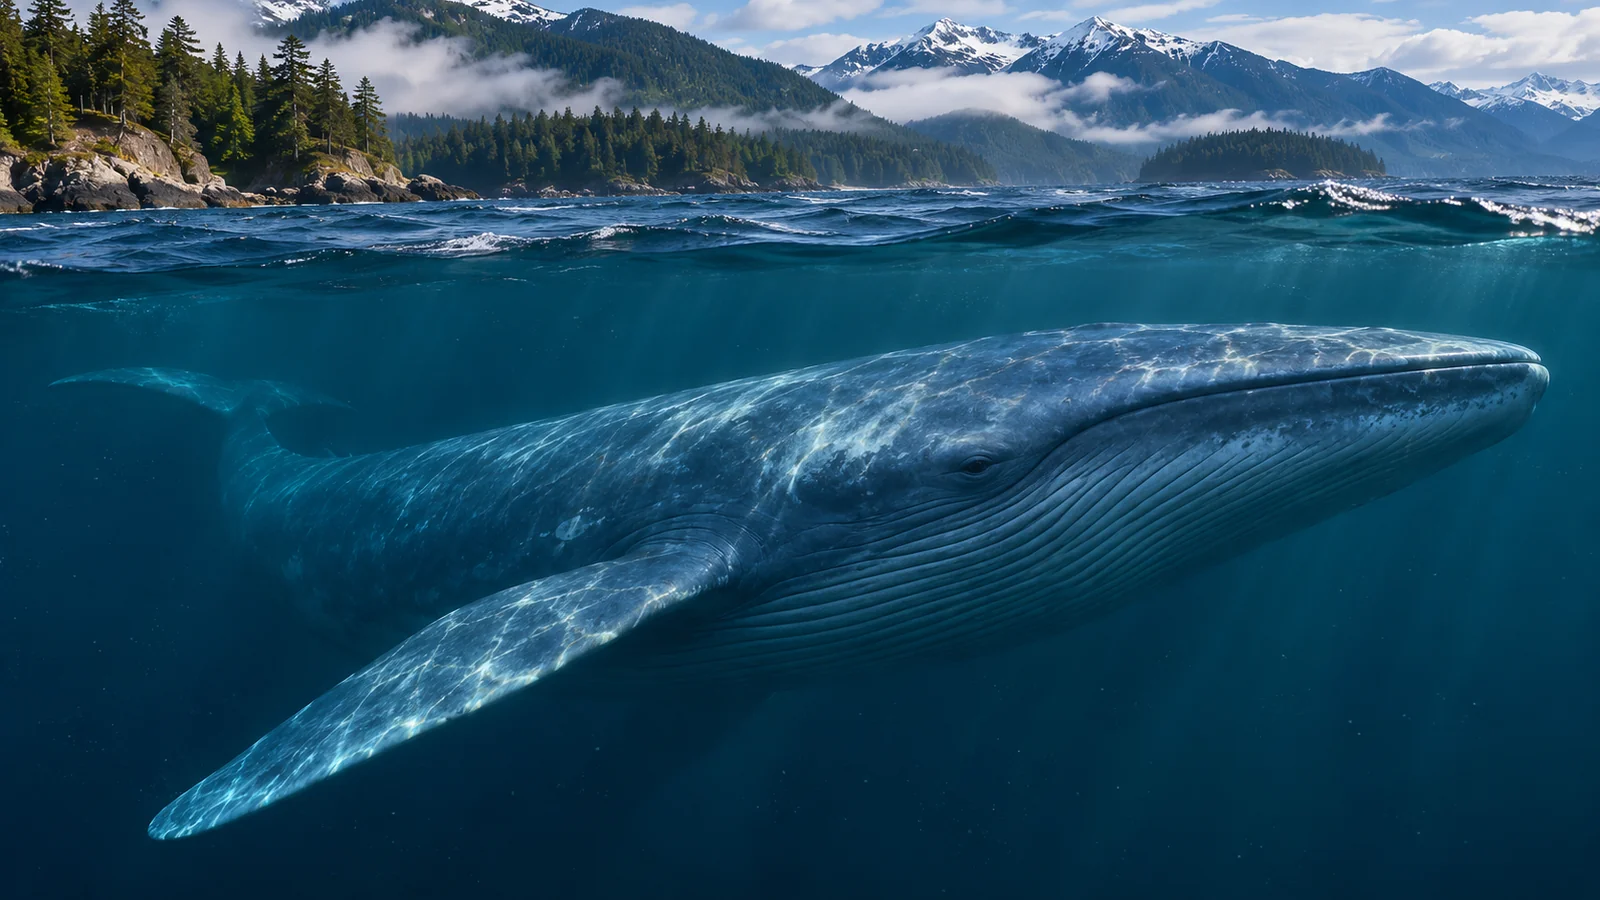
Blue whales feed mainly on krill, and they need to find patches dense enough to make their feeding lunges worthwhile. In the Northeast Pacific, researchers have linked feeding activity to productive parts of the California Current and to temporary changes caused by coastal winds. A hotspot can recur in the same broad area over several years while the most useful prey patch moves within or beyond it from one day to the next. Understanding that difference helps explain why a map of blue whale feeding habitat can show clear patterns without telling you where a whale will appear on a particular morning.
Why the density of krill matters
Krill are small crustaceans. A blue whale can engulf a large volume of prey and water in one lunge, then strain water through baleen and swallow the krill it retains. The whale gains more food from a dense swarm than from an equivalent mouthful of water in which krill are scattered. Finding a feeding area therefore involves more than locating a part of the ocean where krill are present. The prey needs to be sufficiently concentrated at a depth and position the whale can use. NOAA’s blue whale science overview
Imagine two nearby areas with a similar total quantity of krill. In one, much of it is packed into several layers. In the other, it is thinly distributed across the water column. The first area may provide a better opportunity for a whale that captures prey by lunging through a patch. A survey that estimates average krill abundance across a large area and an instrument that detects a tight local swarm are looking at different scales of the same food supply.
This distinction also matters when a survey finds whales but few krill at a particular sampling point. The animals may have moved since a meal, or they may be feeding in a deeper layer that the observation did not capture. They may also be travelling through the area. The interpretation depends on how close the prey measurement is to the whale in time, depth and location. Research on blue whale and krill hotspots in central California
How coastal winds contribute to productive waters
Coastal upwelling brings deeper water toward the surface. In parts of the California Current system, winds can move surface water away from shore, allowing colder, nutrient-rich water to rise. Nutrients can support growth of phytoplankton, the microscopic organisms at the base of much of the marine food web. Krill can feed within this productive system. Time and movement intervene between the arrival of nutrients and the formation of a prey patch a blue whale can use. Research on blue whale migration and resource tracking
A cold plume can move along or away from the coast after it forms. Boundaries between bodies of water, eddies and currents can affect where organisms are concentrated or retained. An area favourable for production can be close to an area that holds or gathers prey, with different processes doing different jobs. That is one reason whale researchers combine information about water temperature, currents and prey. A temperature image alone can show a plume without showing the krill available to an animal.
Picture a headland that often experiences productive conditions during the feeding season. On a given day, the richest patch may be farther along the coast, near an edge of a plume or concentrated below the surface. A seasonal map could still mark the headland as part of a recurring hotspot. A person studying feeding that week would need observations that show what changed within the area. Research on wind-driven tracking of resources by blue whales
Returning to reliable areas and tracking short-term changes
A study of blue whale movement in the California Current compared a decade of movement data with the timing of phytoplankton blooms. The researchers found evidence that whales moved in ways that aligned with the long-term seasonal pattern of productivity. They interpreted this as evidence that experience or memory of reliable feeding areas helps guide migration. A known area can be worth visiting even when a whale has yet to encounter the prey conditions there that year.
At a smaller scale, researchers have studied blue whales moving with short-lived changes in feeding habitat associated with wind-driven upwelling. They used acoustic observations and information about ocean conditions to follow activity through time. An animal can travel toward a generally reliable region and then adjust within it as conditions change. The two studies examine different scales and can inform the same account of how blue whales find food.
One way to make sense of those findings is to ask which choice the whale faces. At the scale of a migration, the relevant choice may involve reaching a broad part of the coast at a useful time of year. At the scale of a feeding dive, the relevant choice may be which layer or edge of a prey patch to enter. The first question can be studied with a long history of locations. The second may require measurements taken near the whale while the prey patch is present.
What researchers actually measure
Tracking data can show where an animal went during the time a tag provided locations. Certain patterns of movement may suggest that it was searching or spending time in an area. A position alone usually cannot show the prey the animal captured. Other instruments can help by recording characteristics of dives and changes in movement. Researchers can then compare those observations with independently collected information about the surrounding water or prey.
Hydrophones record underwater sounds. A study can use detections or directions of calls to investigate where calling whales were active, including times when visual observations would be difficult. A whale has to produce a detectable sound for the instrument to record it. An acoustic observation may therefore establish where some whales were calling while leaving the location of silent whales uncertain. The wind-driven tracking study describes what its sound records show alongside ocean measurements.
Ship-based measurements can add information about the prey field. An instrument may detect layers or patches of organisms below the surface. The researchers still need evidence about which organisms produced the signal. A layer might contain fish, krill or a mixture. The wind-driven study discusses cases in which acoustic scattering mainly reflected forage fish while the researchers used evidence about how prey groups aggregated in upwelling conditions to interpret the broader pattern. Read the methods before treating every bright patch on an acoustic image as krill.
How to read a blue whale hotspot map
Look at what the map shows first. A blue whale hotspot could indicate a concentration of past sightings, a modelled probability of occurrence, an area of repeated feeding activity or a region where whales and dense prey often overlap. Those descriptions can lead to similar-looking maps with different purposes. NOAA’s overview of blue whale hotspots, for example, also discusses the management significance of places where whales overlap with vessel activity. NOAA’s blue whale hotspot overview
Then check the time period. A map that combines years can reveal areas that repeatedly matter. It smooths over changes that might stand out if you examine individual seasons. A map built from several days can capture an event that would disappear into a long-term average. If two maps show different patterns, ask whether they use the same scale, season and observation method before treating the difference as a change in whale abundance.
Finally, check where the researchers looked. A study focused on central California can provide strong evidence about its study area. It cannot establish the same level of detail for British Columbia or Alaska. A regional map is most useful when you understand the gap between the places that appear on the map and the places actually sampled. A species can occur beyond the boundary of a particular dataset.
What a British Columbia traveller can take from the research
Canada’s recovery strategy describes blue whales in Pacific Canadian waters as part of a wider offshore context and identifies gaps in knowledge about the species’ distribution. The well-studied feeding examples from the California Current show how the ocean can organise food for a very large animal. They do not establish a predictable viewing opportunity from Campbell River. If you are choosing a local tour, use the operator’s description of its trip and the wildlife it typically discusses for that region. Canadian Pacific blue, fin and sei whale recovery strategy · Eagle Eye’s Campbell River whale watching tour
You can still bring the prey question with you. If a humpback appears near birds or a patch of fish, ask what clues the guide can see about the food concentrated there. A humpback can use fish as well as krill. The local encounter can illustrate why predators pay attention to patchy food, while the blue whale research explains how a krill specialist addresses the same broad problem elsewhere in the Northeast Pacific. Eagle Eye’s guide to marine wildlife on whale watching tours
A guide might point out a current line, birds diving or an area where fish break the surface. Such clues can give a visitor a way to discuss where prey gathers. A surface pattern gives little information about the density of a deep krill swarm. That distinction is useful in its own right. It explains why an observer on a boat and a research team mapping the water below it can both learn from the same area while seeing very different things.
How a hotspot can shift within one season
An area can support feeding repeatedly without holding a single permanent patch. Imagine researchers find whales and signs of dense prey on several days near a familiar part of the California coast. When winds change, the plume they are studying moves. The next survey may find activity near another edge of the same feature. A summary from the season might still identify the broad area as productive. A daily record would preserve the changes that a summary averages out.
For a management question, both records matter. A recurring hotspot can help identify where overlap between whales and vessels deserves attention. Short-term observations can help explain why overlap changes within an area. To interpret a specific chart or recommendation, check which timescale it addresses. A study of seasonal habitat and a study of whales following a plume are useful for different decisions.
Frequently asked questions
Are blue whale hotspots always in the same place?
Some broad areas are used repeatedly and appear in multi-year studies. Actual prey patches can shift as winds, currents and other conditions change. Read the time period of a hotspot map before using it to interpret a single encounter.
Do blue whales simply follow cold water?
Cold surface water can be associated with upwelling. Researchers study how upwelling, productivity and prey distribution are connected. A cold patch alone does not tell you whether suitable krill are present or at a depth where whales can feed.
Can researchers tell that a whale is feeding from a position on a map?
A position establishes where the whale was recorded. Motion data, observations of feeding, and nearby prey measurements can strengthen an interpretation. A whale can also cross an area while travelling, even if feeding has been observed there on other days.
Is a blue whale a likely sighting on a Campbell River trip?
The offshore and California Current studies describe regional blue whale ecology. Use the operator’s current trip information to choose a Campbell River outing, and expect the wildlife observed to depend on the area and conditions that day.
If you are looking at a record of blue whale activity off Canada, check whether it came from a photograph, a sound recording or a model. Each can support a different statement about the animal’s presence.