
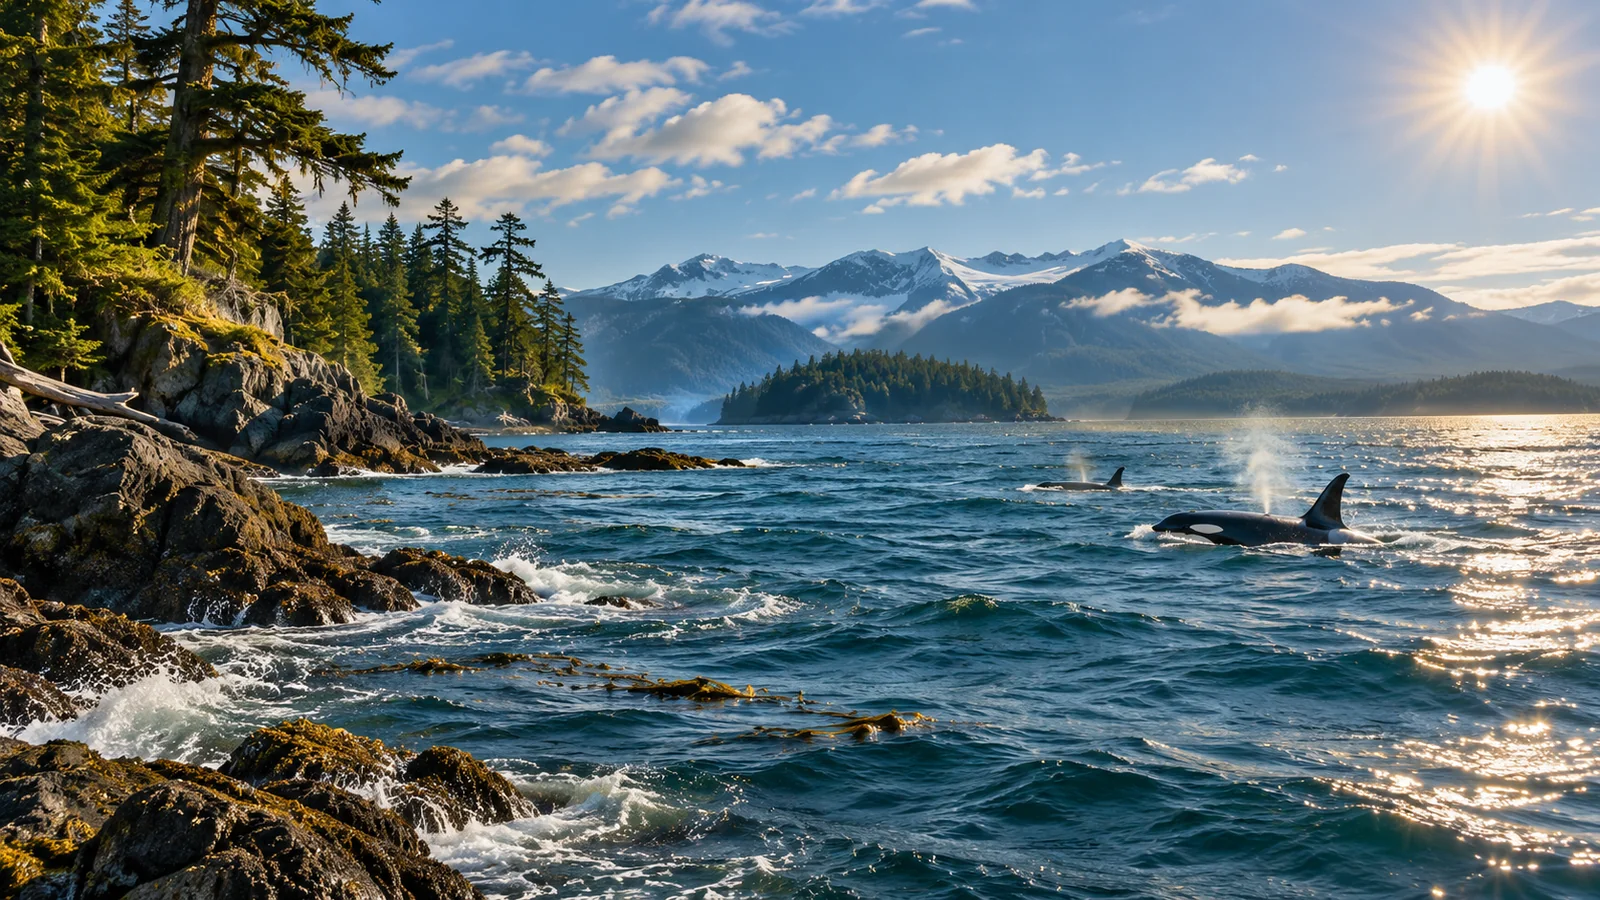
A marine heatwave can affect humpback whales by changing the food available in the places where they feed. Changes in the abundance, location or condition of prey can have consequences that appear later in whale survival and calf records. In the Northeast Pacific, long-running studies tracked humpbacks before, during and after a major warm period in 2014 to 2016. Some records showed substantial declines, while other places and populations followed different patterns. That variation matters in British Columbia, where an encounter near Campbell River offers a view of one part of a humpback’s range and only a moment in a longer environmental change.
What makes a marine heatwave?
A marine heatwave is a period of ocean temperatures unusually high for the place and time of year. Researchers compare conditions with a local seasonal reference. Water that feels cold to a swimmer can be unusually warm for an area in winter. A hot afternoon on shore says little about whether the water has experienced a sustained warm event. Researchers use temperature records over time and define how long and how unusual the conditions have to be. National Park Service account of the Northeast Pacific marine heatwave
The depth and coverage of warming can vary across an event. A satellite picture of surface conditions is useful for seeing the broad extent of warm water. Fish and krill can occupy layers far below the surface, and nearby channels can experience different conditions. Researchers want to know where the unusual temperatures extended and how they overlapped with the habitat that supported prey.
The 2014 to 2016 Northeast Pacific event is particularly informative because several whale monitoring projects had collected observations for years before it began. A series that starts in the middle of a warm event might show which whales were present at that time. A long record supplies a comparison with earlier years and makes it possible to ask whether survival, returns or reproduction changed as conditions changed. Glacier Bay and Icy Strait long-term humpback study
Follow the effect through the food web
Humpbacks feed on small fish and krill. They can use more than one prey type, and individuals can make use of different feeding areas. The practical question for a whale is whether enough suitable food is concentrated where and when it can reach it. A warm event can affect the distribution of prey, the timing of their seasonal availability or their quality as food. A change in prey density can matter even when the same species are still present. Canadian North Pacific humpback whale status assessment
Imagine a feeding area that normally supports dense schools of fish in summer. If fish become more dispersed or shift to deeper water, a whale might spend longer looking for a useful concentration. If prey become leaner, taking in the same number can yield less energy. If food moves to another part of the coast, an animal may have to alter where it feeds. These are possible routes from changes in the water to changes in the animal’s energy budget. The particular route needs evidence from the event and area under study.
The timing of this process can be important. An animal may still find prey during the heatwave and spend more time or energy obtaining it. A change in body condition, survival or calf production could become apparent after the warmest period. Studies can compare years during and after the event to examine those possibilities. The length of the observation period affects how much of the response researchers can see.
What researchers found around Glacier Bay
Researchers used monitoring from 1985 to 2020 in and around Glacier Bay and Icy Strait in southeastern Alaska to investigate how humpbacks fared during and after the 2014 to 2016 Northeast Pacific heatwave. They had a long history of identifying individuals and observing calves. This gave them a way to compare the affected years with a period in which the whales had been studied using repeated observations.
The study reported declines in humpback survival and reproductive success. The National Park Service summarised a particularly sharp drop in the estimated survival of calves, from about 40 percent before the event to about 3 percent during and after it in the comparison the researchers reported. The finding refers to the monitored animals, period and estimate in this study. Conditions and demographic trends differed across feeding areas.
Survival inferred from sightings requires care. If a whale normally returns to a feeding area and stops appearing, it may have died or may be using other waters. Researchers use repeat encounter histories and statistical models to address whether animals were detected and to estimate survival under stated assumptions. Long-running programmes are especially useful because many of the animals have more than one opportunity to be photographed. Study notes explain how the researchers dealt with the uncertainty.
What the wider North Pacific record adds
Another study used a large collaborative set of photo identifications to model North Pacific humpback abundance between 2002 and 2021. It reported an apparent decline of about 20 percent in estimated abundance between 2012 and 2021 and discussed losses of prey resources associated with the marine heatwave as a likely explanation. The values are estimates from a model with uncertainty. They should not be reported as a count of observed deaths. North Pacific humpback population modelling study
The researchers found differences among wintering groups. The decline was evident in the estimated abundance of whales wintering in Hawaiʻi, whereas the study did not find an equivalent decline in mainland Mexico breeding humpbacks. A separate analysis covering the main Hawaiian Islands investigated abundance and other demographic measures across breeding seasons. Those results are valuable for understanding a particular part of the migration system. They cannot be applied to every whale photographed on a British Columbia feeding ground. NOAA repository record for the main Hawaiian Islands demographic study
The studies approach the question from different parts of the whales’ range. The Glacier Bay work followed use of a feeding area and the histories of animals seen there. A wintering-ground study examines whales present during the breeding season, many of which feed far away. A basin-wide model brings records together over a much larger area. Comparing these approaches helps researchers investigate whether a local pattern belongs to a broader change or reflects movement or conditions at one place.
Why changes in reproduction can appear later
A humpback moves between areas that support different parts of its annual cycle. A whale feeding in a high-latitude area may later use energy accumulated there during travel and breeding. A difficult feeding season can therefore matter well after the whale leaves that area. If researchers are investigating calf production, they can ask how the timing of the warm event, feeding conditions and later sightings fit together. A temperature graph and a calf graph may show related changes at different points in the annual cycle.
Researchers also distinguish several ways of describing calves. The number observed in a season depends partly on how many adults were observed. Calf production can be expressed relative to the number of females, while survival is a different question about what happened after birth. A result framed in one of these measures cannot be directly substituted for another. When a summary says calf numbers fell, look for the definition in the underlying study.
A later improvement in one measure can leave other parts of the record changed. If more calves are seen in a later year, that is an important observation. It does not tell you how many whales survived an earlier period or whether food conditions returned to their previous pattern across the Northeast Pacific. The most useful comparisons specify the location, time period and demographic measure.
What this means off British Columbia
North Pacific humpbacks have documented links between Canadian feeding areas and wintering grounds in Hawaiʻi and Mexico. Several parts of the population can use a shared feeding region. This is one reason to keep the geographic scope with a research result. An estimate for humpbacks seen in Hawaiʻi is relevant to part of the wider story. It leaves open the response of a particular whale in a British Columbia channel unless there is more evidence about that individual and the conditions it experienced.
A day on the water provides a local observation. If whales are feeding, you may see how prey is distributed near the surface and which other animals are present. A busy scene may coexist with an unfavourable season at larger scales. Equally, a day when no humpback appears gives you too little information to infer a change in the population. To compare trips, note the date, the area covered, the length of the outing and any changes in visibility.
If you take a Campbell River whale watching trip, ask how guides connect a local sighting with the longer record. They may recognise a whale from previous seasons or describe the signs that prey are concentrated. For planning purposes, use the current departure information and choose a trip around the marine experience you want. The studies explain the ecological context. Sightings still depend on the day. Eagle Eye’s Campbell River whale watching tour
How to read a heatwave claim
Identify the event and the comparison first. Check whether a study examined a particular temperature anomaly, several years before and after one event, or a long-term temperature trend. Then read the outcome. A study of local encounter rates, a calf survival analysis and a basin-wide abundance model can all find changes while measuring different things.
Look for the evidence connecting warming with the outcome. A paper may combine temperatures with prey data, whale encounter histories or evidence from a neighbouring region. An association in time can prompt further investigation. An explanation becomes stronger when researchers can show how changes in prey or whale condition fit the timing and geography of the event. Keep the authors’ degree of certainty when reporting their conclusions.
Pay attention to the point at which the study ends. A sustained change through the final year can establish a lasting effect over the period covered. A later recovery in the same waters would require later monitoring. If you find a newer estimate, check whether it uses the same study area, animals and season before combining the figures. A newer analysis can extend an earlier series or measure a different part of the population. Reading that distinction prevents a change in study design from looking like a change in whale numbers.
Frequently asked questions
Do warm waters harm humpbacks directly?
The documented Northeast Pacific example emphasises disruption to the food web and the consequences of reduced prey resources. The important question is how conditions change what whales can eat and where they can feed.
Can a marine heatwave change where people see whales?
Prey can shift in location or depth, and whales can respond by using other areas. A local change in sightings also depends on who looked, where they looked and how often. Several seasons of comparable observations provide more information than a single trip.
Does a population estimate tell scientists exactly how many whales died?
An estimate describes the abundance inferred from the data and methods used. To understand changes in abundance, scientists may also consider survival, reproduction, movement and detection. Read the definitions and intervals alongside the headline figure.
Do effects end once the temperature falls?
Researchers have documented effects during and after a major warm event. Food webs and whale demographics can respond on different timescales. The length of any effect depends on the region and the outcome being measured.